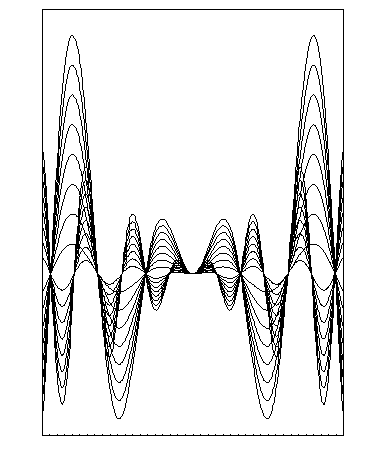
Plot a one-dimensional function and loop


Plot a one-dimensional function and loop

1 2 MACRO PLOT 1=8 * The Macro parameter is the number of plots to be drawn. * the defaults is 8. set dmod 1 3 SET XTIC 0.0001 3 SET YTIC 0.0001 set xval 100. set yval 100. opt utit fun/plot x*sin(x) -10 10 fun/plot x*cos(x)*sin(x) -10 10 s a=[1]-1 do i=[a],1,-1 fun/plot x*sin(x)*[i]/[1] -10 10 s fun/plot x*cos(x)*sin(x)*[i]/[1] -10 10 s enddo

  1. In this example we can see that macros can have input parameters. These parameters can be positional, and they can be accessed in the macro via [n] , where n is the parameter number in the input list, or they can be specified by name and they are accessed like variables. The next example gives more details on the input parameters management.
  2. If one parameter (positional or not) needs to have a default value, the value can be specified on the MACRO line. At execution time this default value is taken if no value is given. Note that for parameters given by name, the default value on the line MACRO is mandatory.
  3. It is possible to define the geometry of a picture via the SET parameters described in the section setting attributes of the chapter Graphics (HIGZ and HPLOT) in the PAW manual. In this example the size of the tick marks is set to 0 ( XTIC and YTIC ). But it is not possible to specify: SET XTIC 0 as, for the SET command, 0 means default value.


PAW TutorialLast update: 1999/04/01 14.57
Olivier.Couet@Cern.Ch