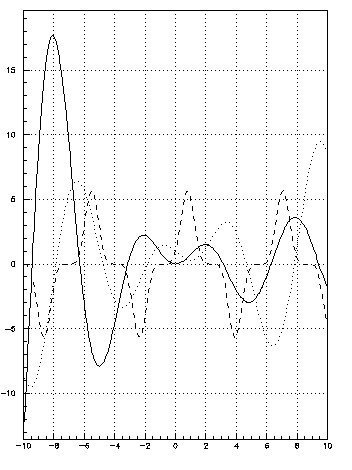


Plot a few one-dimensional functions

* FUNCTION/PLOT UFUNC XLOW XUP [ CHOPT ]
3     OPT GRID
1     FUNC/PLOT X*SIN(X)*EXP(-0.1*X)  -10. 10.
2     SET DMOD 2
      func/plot (sin(x)+cos(x))**5    -10. 10. s
      set dmod 3
      func/plot (sin(x)/(x)-x*cos(x)) -10. 10. s

-
FUN/PLOT
allows to plot 2D functions.
The character
`` x '' or `` X '' is used as the variable name. The command
FUN1
is analog to
FUNC/PLOT
but it produces also an histogram with the value of the function.
The number of steps used to compute the function along the X axis
can be defined via the command
POINTS .
Note also:
- SET DMOD allows to define the line type for the
drawing the function. Note that SET LTYP (the generic
attribute for lines) cannot be
used is this case because in the command FUN/PLOT many
different lines are drawn (axes, boxes, etc ..). So a specific
attribute must be used ( DMOD ) for the line type of a function
or an histogram.
- OPTION GRID allows to have a grid on the subsequent plots.


Last update: 96/05/24 17.19 Olivier.Couet@Cern.Ch


