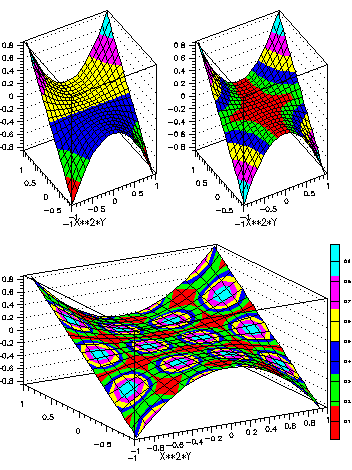


Errors representations on 2D histograms

Errors can be mapped on the colours
      zone 2 2
      fun2 2 x**2*y 20 -1 1 20 -1 1 ' '
      fun2 3 sin(x)*cos(y) 20 -6 6 20 -6 6 ' '
      h/plot 2 surf1
1     H/PLOT 2 SURF1,E
      zone 1 2 2 s
2     V/CR ERR(400)
2     GET/CONT 3 ERR
2     PUT/ERR 2 ERR
2     H/PLOT 2 SURF1,E,Z

- 2D histograms can be plotted with errors. With options, like SURF1, in
which colors are involved, the errors are mapped onto the color map.
- By default the errors on a histogram are the square root of the
content. It is possible to define the errors with the command
PUT/ERR .


Last update: 96/05/24 17.21 Olivier.Couet@Cern.Ch


