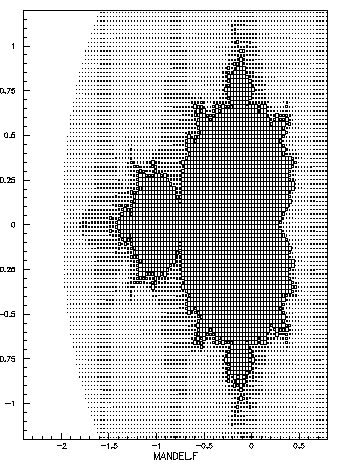


The Mandelbrot distribution

Calculate and plot (BOX option) the Mandelbrot distribution
1     FUN2 10 mandel.f [1] -2.4 .8 [1] -1.2 1.2 ' '
2     HI/PL 10 BOX
FORTRAN Routine MANDEL
      real function mandel(xp)
3     dimension xp(2)
      data nmax/30/
      x=xp(1)
      y=xp(2)
      xx=0.
      yy=0.
      do n=1,nmax
         tt=xx*xx-yy*yy+x
         yy=2.*xx*yy+y
         xx=tt
         if (4..lt.xx*xx+yy*yy) go to 20
      enddo
   20 mandel=float(n)/float(nmax)
      end

- This example shows one of the usages of COMIS. In this case,
the name of the function to be plotted by FUN2 is replaced by a
COMIS FORTRAN function.
- CHOPT=' ' in the command FUN2 means to fill only the
histogram without producing the plot which is by default a surface.
The plot is produced by the command HIST/PLOT .
- The vector XP is an input parameter given by FUN2 , for
each cell, to the FORTRAN program. XP contains the X
and Y coordinates of each cell. You can try to insert:
print*, XP
in mandel.f to see the values changing (in this case it is better to
set the input parameter of the macro to 10).


Last update: 96/05/24 17.19 Olivier.Couet@Cern.Ch


