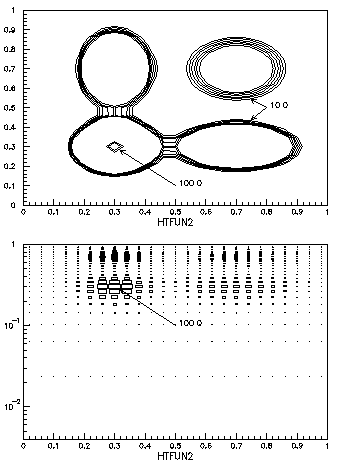
Non equidistant contour plots

User defined non equidistant contour plots
histogram/file 1 pawhists.hbook
1 VECTOR/CREATE LEVEL(8) R 10 11 12 13 14 15 90 99
zone 1 2
2 CONTOUR 200 8 2 LEVEL
arrow .8 .75 .5 .54 .2
5 ARROW .8 .75 .5 .44 .2
4 SET CHHE .28
3 ITX .81 .5 '10.0'
Arrow .5 .32 .1 .28 .2
Itx .51 .1 '100.0'
option LOGY
h/plot 200 BOX
6 ARROW .5 .32 .1 .28 .2
6 ITX .51 .1 '100.0'
close 1
The command CONTOUR allows to draw user defined levels.

- The vector LEVEL contains the list of 8 levels to
be drawn.
- Only the levels specified in the the vector LEVEL are drawn.
Note also:
- Some comments can be drawn with the command ITX .
- The size of the text is in centimeters even if the position is
in histogram coordinates (current normalization transformation).
- The position of the arrow is in the current normalization transformation
(here histogram coordinates), but its size is in centimeters (last
parameter. Here 0.2).
- Arrows and text can be drawn in logarithmic coordinates. For lines
the logarithm should be computed with SIGMA.

Last update: 96/05/24 17.21 Olivier.Couet@Cern.Ch